You can export data containing density information through the export wizard. Options include writing output images with the number of points in given cells as the cell values, writing absolute density values of given cells as cell values, and creating tiff images.
Open the LP360 Export Wizard by clicking the Export LIDAR Data command on the LP360 toolbar. The Export Wizard dialog will open with the Step 1 of 3 page displayed.

Click the arrow in the Export Type list, and select Surface.

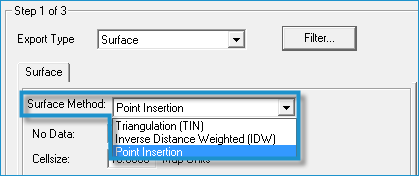
Click the arrow in the Surface Method list and select Point Insertion.
Learn more about surface methods
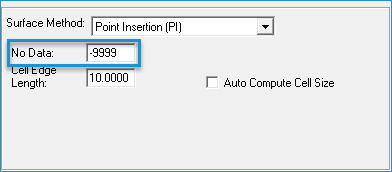
Enter a No-Data value for the output TIFF files.
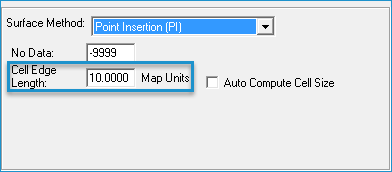
Enter a Cell Edge Length greater than zero Map Units.
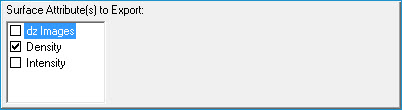
Under Surface Attribute(s)
to Export, select Density
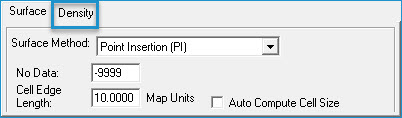
Select the Density tab that appears next to the Surface tab.
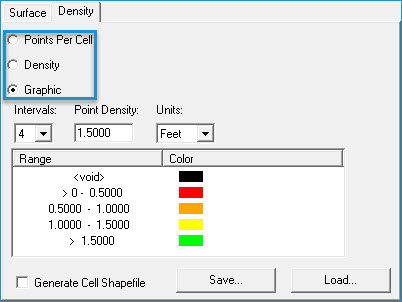
Select one of the following options: "Points Per Cell",
"Density", and "Graphic". The "Points Per
Cell" option writes
the number of points in given cell as the cell value in the output
image. The “Density” option writes the absolute density value
of the given cell as the cell value in the output image. The “Points
Per Cell” and “Density” options produce .flt
files (floating point images) and "Graphic" produces a tiff
image.
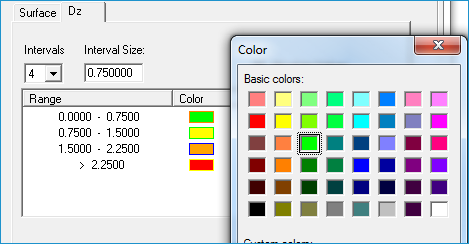
Select the number of intervals (from 3 to 10) for the dz images in the Intervals list. Based on the number of intervals you set here, along with the interval size, the Range column in the table displayed below displays the elevation ranges and the Color column displays the color that will be used for the range next to it.
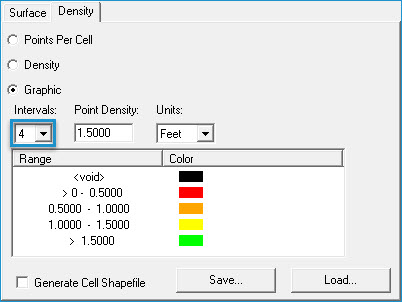
Note To
change the color associated with a particular range, double-click
the color box in the Color column and select
a different color in the color selection dialog. |
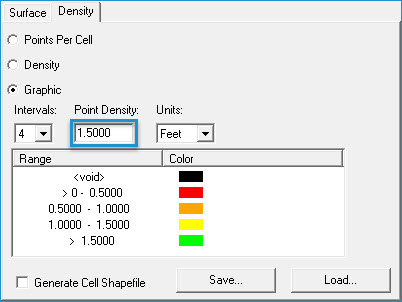
Enter an Point Density for the images.
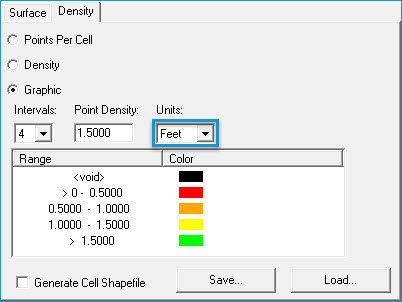
Select Units to be in
feet or meters.
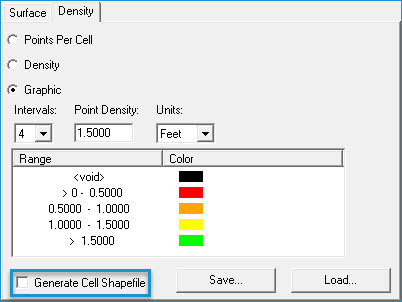
Select Generate Cell Shapefile to create a shapefile with a grid for the cells in the output.
Click Next.