About the Color Bands
LIDAR points that have color values
will have at least three valid bands of colors (i.e., red, green,
and blue) and an optional infrared band. The red, green, blue, and
infrared values within the points are measures of the amount of reflected
energy within each respective portion of the light spectrum.
The color values can be used to generate colors on the screen by assigning
a band to a color component. Two of the most popular examples are
true color composites and
false
color composites. A true color composite is generated by assigning
the red, green, and blue bands to the their respective red, green,
and blue color values that are displayed on the screen. The result
is a "normal" color photograph that is typically seen with
the naked eye. A false color composite or a color infrared image is
generated by assigning the green, red, and infrared bands to blue,
green, and red color values respectively. Objects in a scene will
be colored much differently in a false color composite than in a true
color composite forming the basis for numerous remote sensing applications
and interpretation.
Additional Reading
Lillesand, Thomas M., Ralph W. Kiefer.
Remote Sensing and Image Interpretation.
John Wiley and Sons.
How to Select the Color Bands
Color Band Boxes 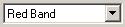
1. Open the Properties dialog box by clicking the
 button
on the LP360 toolbar.
button
on the LP360 toolbar.
2. Click the Symbology tab, then click the RGB
Values tab.
3.Click the down arrow on the red, green, or blue boxes.
4. Select a color band to assign to the color value of the respective
box.
Tip
- If a false color or color infrared image results from
a true color setup (i.e., red->red,green->green,blue->blue),
the LIDAR point's red, green and blue band values were
assigned from an image instead of assigning the green,
red, and infrared band values. In this case, a true color
image can not be generated from the LIDAR points.
|
