Picture of the Density Property Page
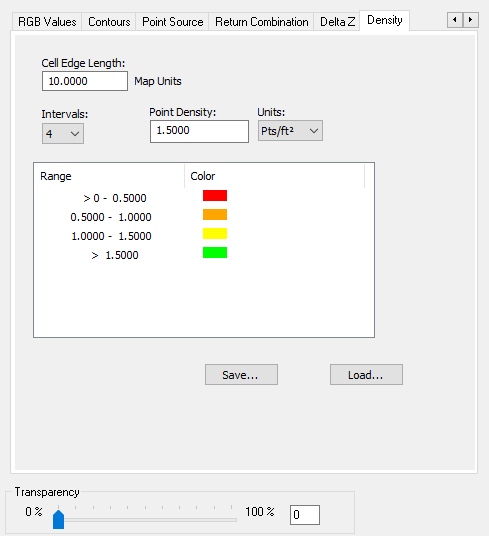
Transparency makes the display more or less transparent, depending on the setting.
How to Modify the Point Density Legend Properties
1. Open the LAS Layer Properties dialog box
by clicking the  button on the LP360 toolbar.
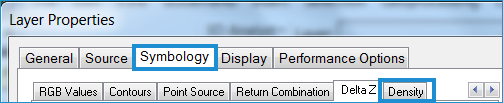
2. Click the Symbology tab, then click the Density tab.
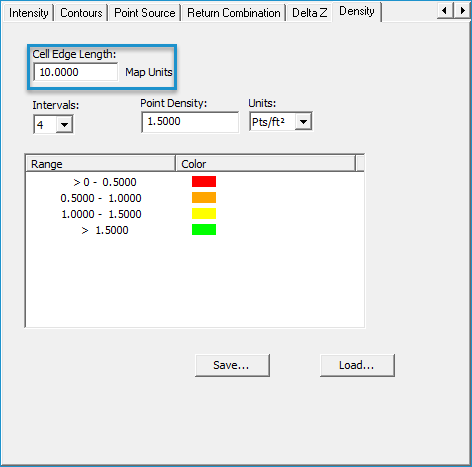
3. Under Cell Edge Length, enter a value greater than zero Map Units.
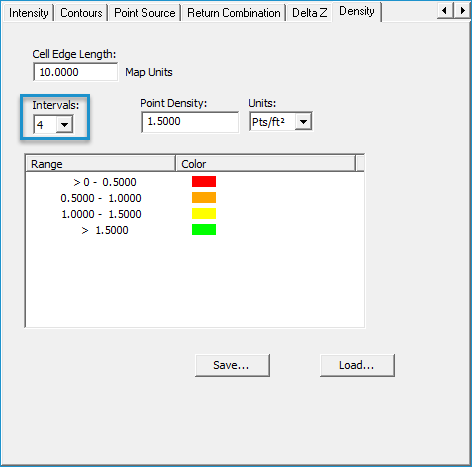
4. Select the number of intervals (from 3 to 10) for the points in the Intervals list. Based on the number of intervals you set here, along with the interval size, the Range column in the table displayed below displays the elevation ranges and the Color column displays the color that will be used for the range next to it. There can be as few or as many as the user desires. These settings will determine how the points are displayed in the map. Smaller ranges may make the differences in point density and cause them to "pop" more.
Note To
change the color associated with a particular range, double-click
the color box in the Color column and
select a different color in the color
selection dialog.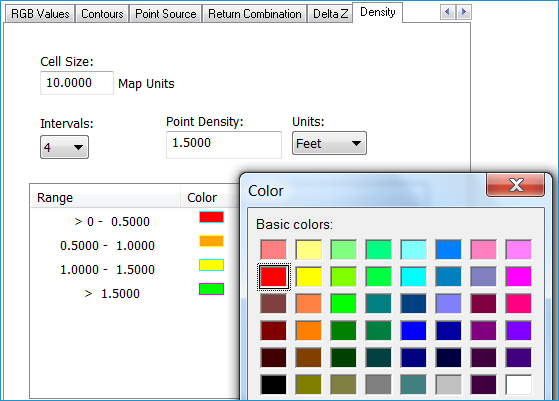 |
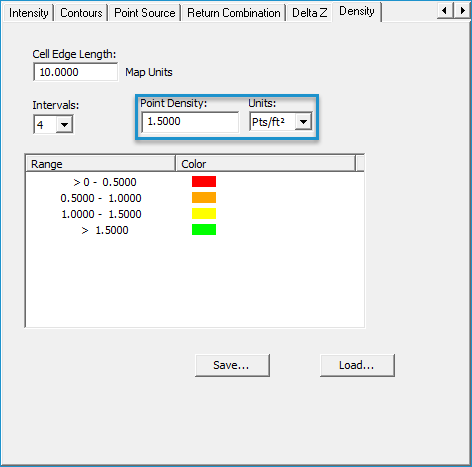
5. Enter a Point Density value and select the type of Units for the value you are specifying. Point Density calculates a magnitude per unit area from point features that fall within a neighborhood around each cell.
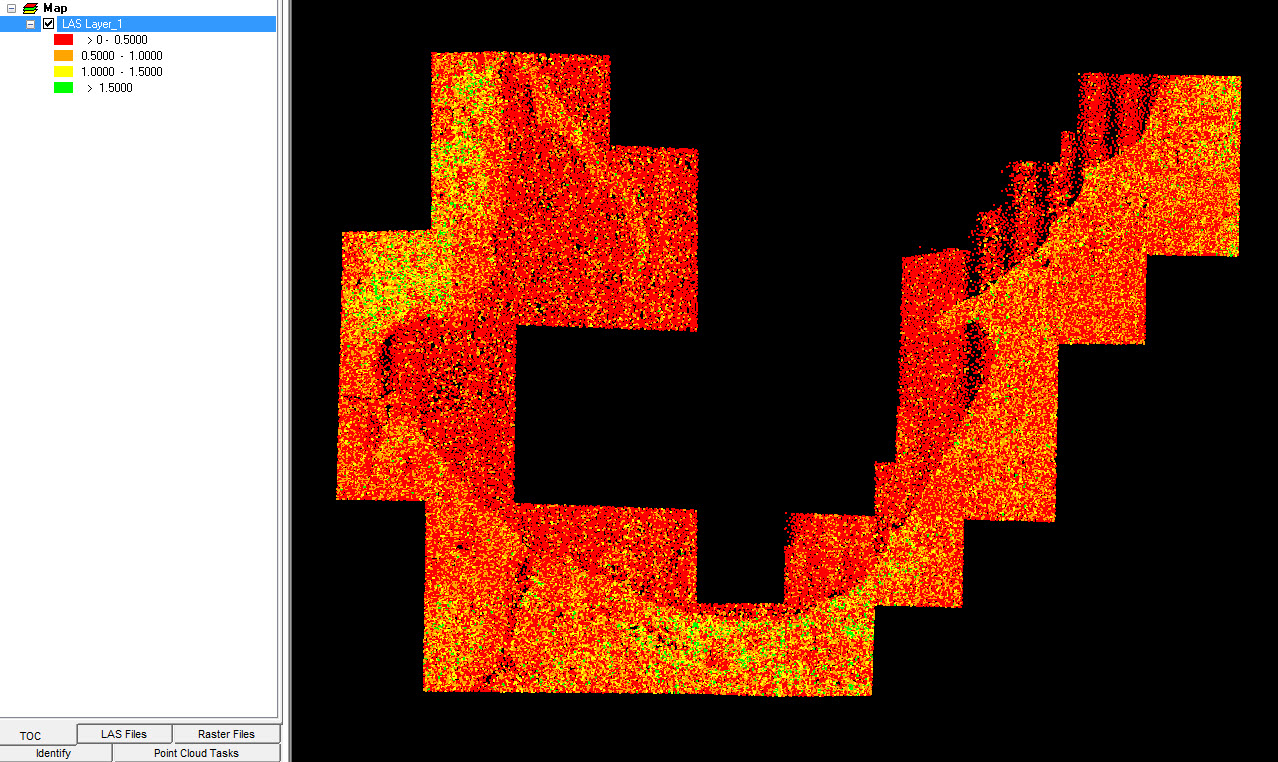
6. Click OK and the LAS files displayed by point density in the map.