On the LP360 toolbar, click the arrow next to the Display by Legend button.

Select the Display by Elevation button.
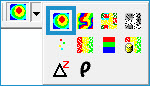

The Display by Elevation legend type displays points and derivatives color-coded by their elevation values.
The symbology is set on the Elevation tab on the LIDAR Properties dialog box, under the Symbology tab.
On the LP360 toolbar, click the arrow next to the Display by Legend button.
Select the Display by Elevation button.