On the LP360 toolbar, click the arrow next to the Display by Legend button.

Select the Display by RGB Value button.
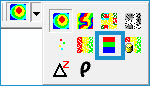

The Display by RGB Value legend type displays LIDAR
data using color data stored in each LIDAR point. The color data stored
in the points mush have at least three bands of red, green, and blue
to form a traditional color image.
Displaying by RGB Value also provides the option of Color/standard
deviation stretching. It is turned on by default and has a value of
two, but can be turned off on the RGB Values tab
in the LIDAR Properties dialog box
under the Symbology tab. Other settings that determine
the manner of display is also set on this tab.
On the LP360 toolbar, click the arrow next to the Display by Legend button.
Select the Display by RGB Value button.