When creating a greyscale (or inverted greyscale) LIDAR Ortho Raster, you may want to adjust how your intensity values are displayed in the output image(s).
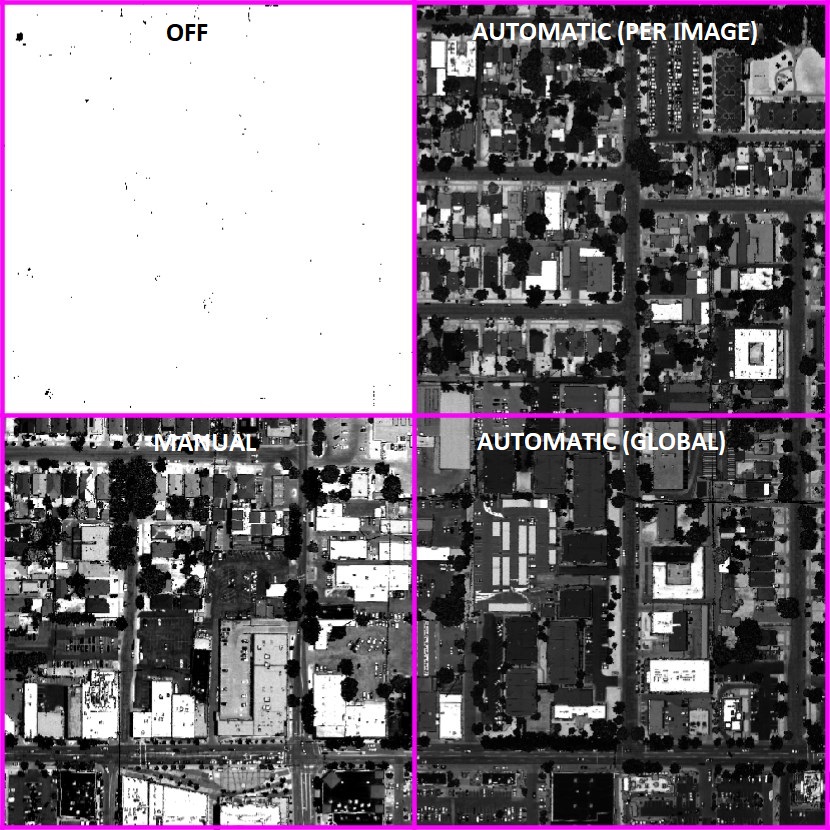
Off: This does not apply any adjustment to the intensities.
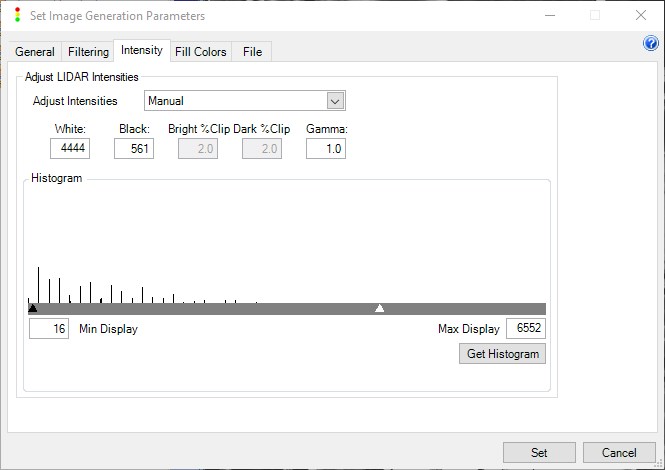
Automatic (per image): Each image is automatically adjusted based on a % clip algorithm. The algorithm works by setting a percentage of the brightest and darkest intensities to 255 and 0 respectively, and scaling the remaining values to cover the full display range of the monitor. The % for bright and dark clip can be specified in the Intensity tab under Set Image Generation Parameters. This is the default setting.
Automatic (global): Works similarly to Automatic (per image), but the algorithm is applied to the entire working set specified on the General tab under “Set Image Generation Parameters”. Automatic (global) can be useful if you want to improve the appearance of a “checkered” raster output, or one that has hard lines between images.
Manual: Allows you to control the min and max values that will be displayed. A “Get Histogram” button will let you see where your brightest and darkest colors are falling, with a black and white triangle showing your min and max values. The manual setting will require some trial and error to determine the best values to apply to your output.
For more information about Intensity image generation, please refer to the LIDAR 1 CuePac User Guide. Sections 12.1.2.1 and 12.1.2.3.
