We will be releasing the second major update of LP360 in December of 2018. LP360 is a major focus for GeoCue software development and it really shows in this new release. LP360 is delivered in two platforms; an extension to ArcGIS (“LP360 for ArcGIS”) and as a standalone 64-bit application for Microsoft Windows® (“LP360”). When you purchase LP360 (or renew maintenance), you receive a license to both platforms, allowing you to choose the one that works best for a particular task.
Our last few releases have been focused on the native Windows platform since we do not yet have an implementation for ArcGIS Pro. ESRI has not yet released a software development kit (SDK) that allows third party developers who need to be “on the metal” an interface strategy. I think they are plenty busy with getting Pro feature complete. When an SDK is released, we will put together a strategy for migrating LP360 to Pro. In the meantime, I strongly recommend that you do all your serious LIDAR work in the native Windows version of LP360. It provides much higher performance than either ArcMap or Pro and contains a very rich and productive feature edit environment.
In this article, I will first provide a bullet list of the major new features and then we will explore a few in detail. In this list, I will use a code of the format (xy – z) to indicate the LP360 platform and the required licensing level. In this scheme, xy is the platform where S is native Windows (“standalone”) and A is ArcGIS extension. Z is the Licensing level (Viewer, Basic, Standard, Advanced). Remember that sUAS is the same as advanced except for the 4 km2 LAS restriction. Thus, for example, (SA-A) would mean the feature is in both LP360 and LP360 for ArcGIS; the required licensing level is “Advanced.”
So, without further introduction, the new major new features include:
- Live View tool for creating and modifying visualization filters has been essentially rewritten. This is the biggest new addition to 2018.2. Adds tools for filtering by Point Source ID, Scan Angle, Elevation, Intensity. Adds new Overlay rendering for visualizations such as multi-level flood fill – (SA – V)
- We created a new Point Cloud Task Manager. This is a major new and very nice feature for those who routinely use PCTs. – (SA – V)
- LIDAR seamline analysis tool added to LP360 (it has always been in LP360 for ArcGIS) – (SA – B)
- “Zero of Zero point return” correction tool added to LAS File Analyst – (S – S)
- Renumber Flight Line tool added to LAS File Analyst – (S – S)
- Multithreaded the Ground Classifier Point Cloud Task (PCT) – This is now about 3X faster than the prior version – (SA – A)
- Multithreaded the Basic Filter PCT – Now about 10X faster than the prior version – (SA – S)
- Multithreaded the Export from Surface functions (e.g. export from surface to gridded raster) – note that we rewrote this at the lowest level to obey the Nyquist sampling criteria. This is vitally important for dense data sets. – (S – B)
- Added GeoTIFF and IMG as raster Export formats – (S – B)
- Added a Duplicate Points Classifier PCT – (SA – A)
- A raster DEM import function has been added to allow import raster DEMs with conversion to LAS. This allows round trip editing of raster DEMs. – (SA – S)
- Import and Export of KML/KMZ files – (S – B)
- Transformation of the Spatial Reference System, SRS, (“Coordinate System”) on Feature import – (S – B)
- Synchronize Active LAS Layer mode added to Table of Contents – Allows rapid manipulation in cases where more than one LAS layer is in use – (SA – V)
- Statistical Median mode added to Conflation tools – (SA – S)
- Merge Lines tool added to Feature Edit tools – (S – S)
- Double Line Drain (“River Flattening”) tool added to LP360 feature edit tools (has always been in LP360 for ArcGIS) – (SA – S)
- New edit tools to Disassemble and Assemble multi-part features. – (S – S)
As you can see from the above list, we have been extremely busy this development cycle with work in broad areas of LP360. I want to highlight a few of the major tools that should have wide appeal.
Live View
Several years ago we introduced Live View, a tool that dynamically displays changes in the application of point “filters.” For example, if you turned off ground and turned on low vegetation, these changes immediately displayed with no need to hit an Apply button or dismiss the dialog. This was a great addition to LP360 but it only accommodated Classification and Returns. To vary other display elements, you had to use the property page settings within LP360. While this worked fine, it was a bit tedious and did not provide “live” results. With this release of LP360, we have greatly expanded Live View (available in LP360 and LP360 for ArcGIS, all licensing levels):
- The Classification tab has been completely rewritten (see Figure 1). You can now very easily see which classification flags have been applied to each class. In addition, we have added a Scan function that scans all the files in the project and displays the number of points found in each class.
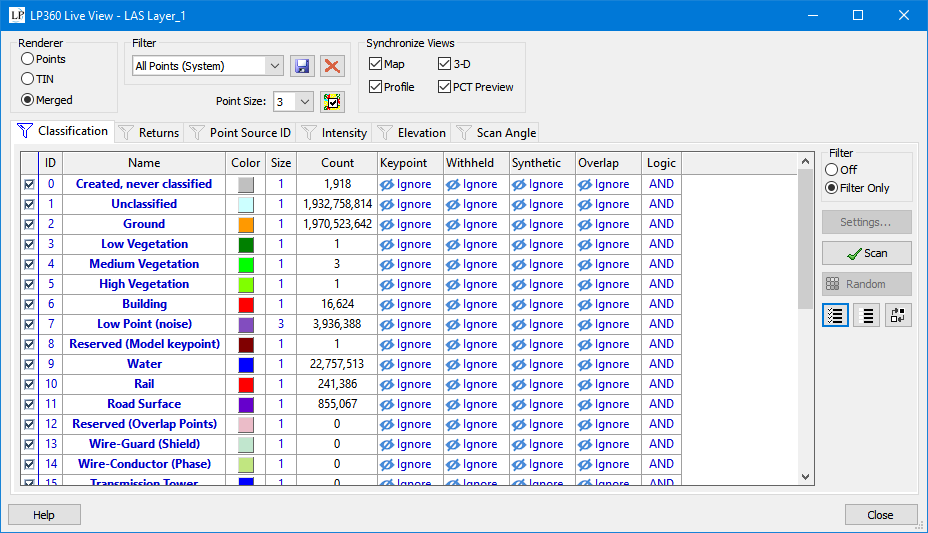
- We have added tabs for Point Source ID (which is usually encoded with the flight line number), Intensity, Elevation and Scan Angle. Note for those of you doing drone LIDAR flights where the flight line is not correctly encoded, there is a new tool in LAS File Analyst that lets you renumber lines.
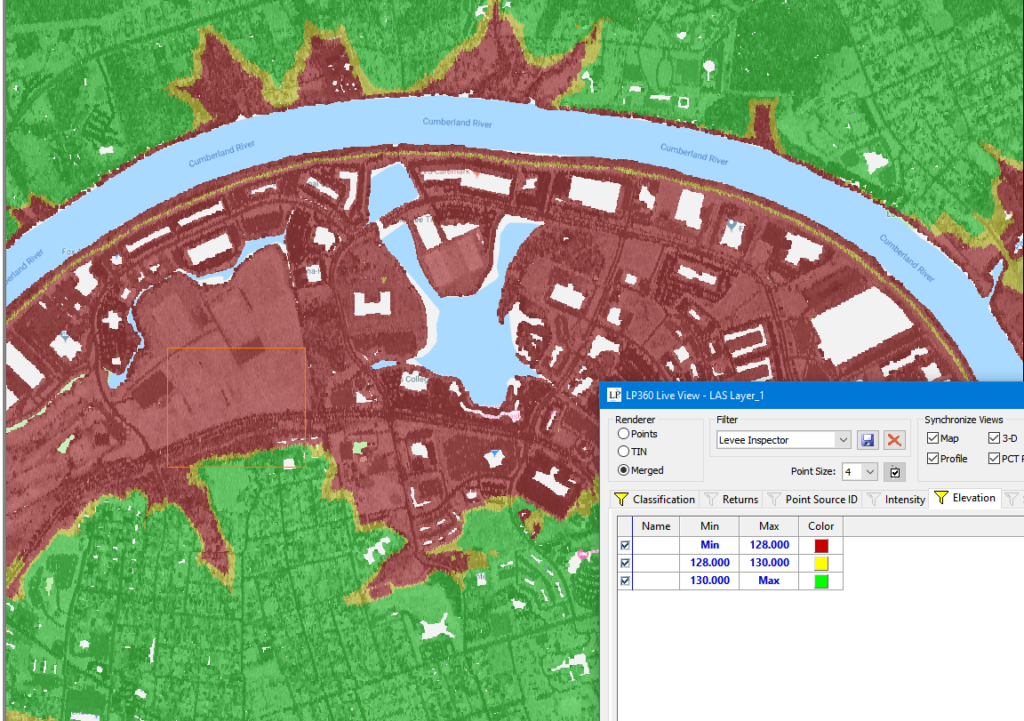
- We have added a new display mode to both the Intensity and Elevation tab that lets you set a value range and an associated color. This is an extremely valuable tool for quick visual analysis. Consider the screen shot of Davidson County, Tennessee (Nashville) in Figure 2. Here I have set three color bands with fixed colors. The yellow band ranges from 128 to 130 meters. In the image, you can clearly see that this captures the top of a levee along the Cumberland river. Under close inspection, there is an area to the east (not shown in the below image) where it looks as if the levee may not be protecting an overpass.
- We have added an eye-dropper sampling tool for elevation, intensity and scan angle. This tool allows you to set range parameters by simply sampling the display
- We have added a dialog that lets you quickly set a range table for Intensity, Elevation and Scan Angle. For example, you can specify for elevation that you want 20 range bands, each 2 meters in height.
- We have integrated Symbology completely into the Live View “filter” concept. This means that for a particular filter such as “My Ground”, you can specify color and point size. This used to be associated with Views in a very difficult to comprehend manner. Now your settings are saved off with your named filters.
- You can “Lock” views together so that if you change the filter applied to a specific view such as the Map View, it will automatically be applied to the other locked views.
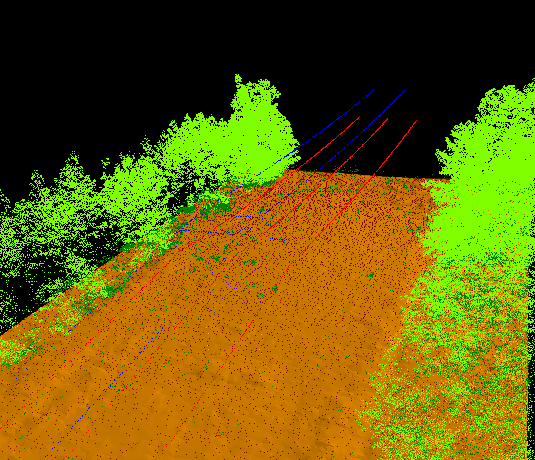
- We have maintained the ability to set different filters for the points and TIN displays. This is very valuable when doing a ground inspection. For example, Figure 3 depicts a power line corridor where ground is being routed through the TIN filter and all other points to the point filter. The display is then set to “Points on TIN.” This yields a very useful and lifelike visualization.
Experiment a bit with the new Live View. I am sure you will invent new uses that never crossed our minds during development. Give us feedback on what works well as well as areas that need some polish.
Point Cloud Task Manager
The central mechanism within LP360 for “batch” processing (besides our command line tools) is the Point Cloud Task (PCT) subsystem. We have added a new management tool called Point Cloud Task Manager (PCT Manager) that helps you organize and execute PCTs. I have many point cloud tasks aimed at different sorts of projects such as drone volumetrics, areal mapping, powerline work and so forth. It is tough to find the specific PCT I am after when browsing an alphabetical list with no other organization. I make this extra difficult by being lazy and naming task instances things such as “A1.”
PCT Manager addresses a lot of these issues, particularly our new Group category. Here is a quick look at some of the features contained in PCT Manager:
- PCT Filters – You will notice that the top section of the PCT tab has changed a bit. We now have a Filter By tool that lets you filter PCTs by Type or by a new category (discussed later) called Group (see Figure 4). This filter makes it much faster to find the particular PCT you are after.
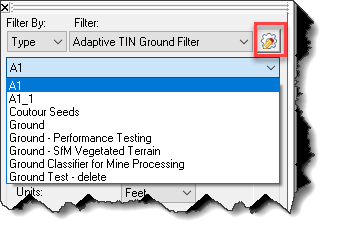
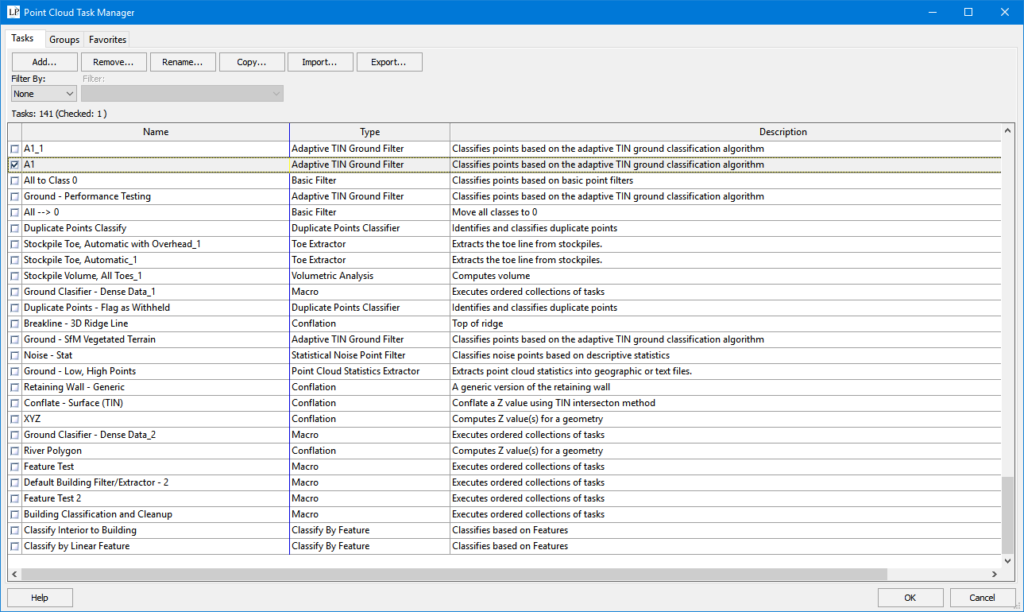
- PCT Manager – This is the heart of the new additions. It is accessed via the pencil/gear tool just to the right of the Filter dropdown (see Figure 4). This invokes the new PCT Manager dialog shown in Figure 5. The dialog comprises three tabs:
- Tasks – these are the individual Task instances that you have created. You can these by Group and Type. You can also sort any column by clicking on the header for that column. There is a bit of an Easter egg here – you can select a particular task and return to the PCT instance dialog by double clicking a row.
- Groups – this is the new facility for grouping tasks
- Favorites – this new capability allows you to sort members of a Group and assign them to Favorites quick select buttons.
- Groups – this new feature allows you to create a group (category) name such as “Mining” and assign PCT instances to that group. This lets you organize a set of PCTs that you commonly use for a particular workflow into a quickly accessible collection. A particular PCT instance can be a member of multiple groups (or no group at all).
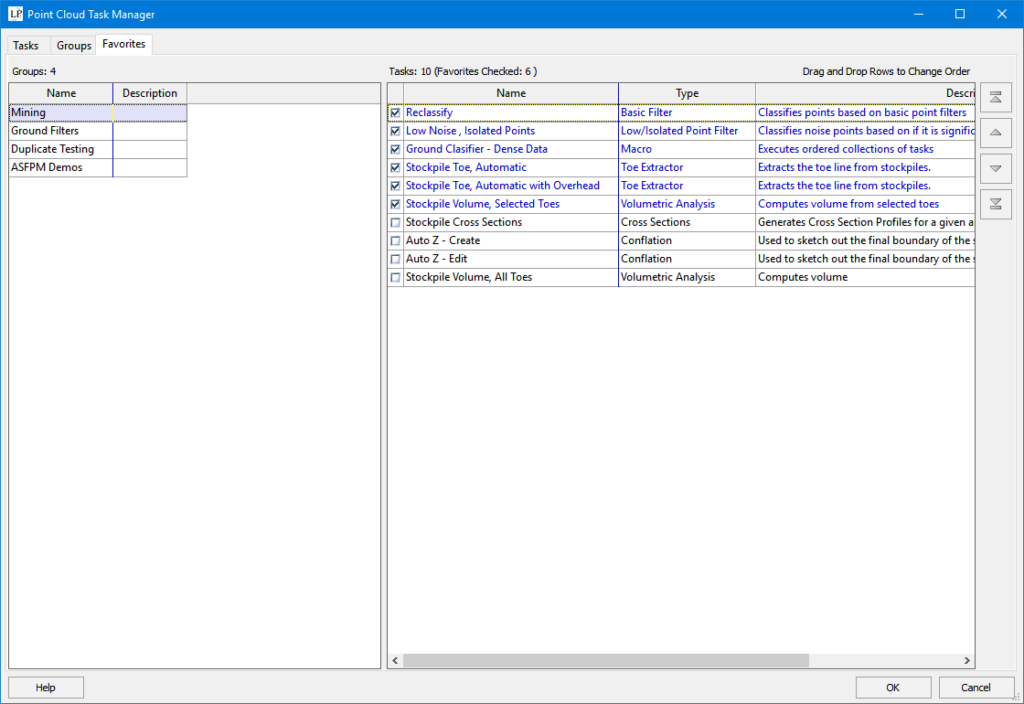
- Favorites – Once you have created a group, you can (via the Favorites tab on PCT Manager) assign members of the group to Favorites buttons that show on the main PCT tab of the table of contents (TOC). For example, in Figure 6 I have selected my Mining group. This group contains 10 PCT instances of various types. The first six instances (the ones with check marks in the left-most column) have been assigned to my Mining group Favorites buttons. The assignment is in the same order that the tasks appear in the list (that is, topmost to button 1, next checked box moving down the list to button 2 and so forth). You can sort the order with the arrow buttons to the right of the table.
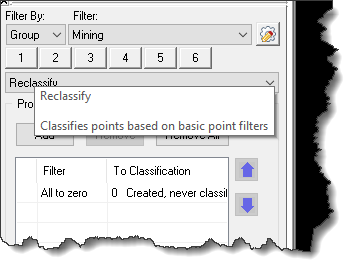
If you have selected Favorites for a group, then number buttons will appear in the PCT tab of the TOC when you select that group in the Filter dropdown. An example is shown in Figure 7 for my Mining group. A tool tip (revealed when you hover the cursor over one of the buttons) displays the assigned task. In my example, I have assigned button 1 to a Basic Reclassification task.
The short cut buttons do not execute the task; they simply set a task as the Current task. Of course, a task can be a PCT Macro (a collation of connected individual PCT tasks).
Finally, I would encourage you to experiment with the editing tools in LP360 (native Windows). These tools are, I think, the best LIDAR-centric 3D editing tools available. We have integrated our 3D conflation point cloud tasks directly into the edit and feature creation tool set. With the addition of double line drain modeling in this release, the migration of edit tools from LP360 for ArcGIS to LP360 is complete. We have also directly integrated the table-based Feature Analyst to enable a very smooth quality assurance system. You can step through both features and vertices with all views synchronized as you arrow through data. This provides an extremely efficient environment for a myriad of feature-centric tasks. We will have a new Feature Edit/Analyst user manual available by the end of the year.
We will be covering new tools in LP360 though a series of webinars that will be conducted over the next few months. As always, please give us feedback on what works well, what needs improvement and tools you would like to see us add.
